In which area of Bogotá should we pilot our Urban95 intervention? We spent four months gathering and analysing data to choose first an area of the city, then a central point within that area, and then which streets around that point should be included. Here’s how we did it.
We started by creating a “heatmap” of the city, to visualise where young children face the greatest challenges. Our heatmap combined ten indicators for which we could find publicly-available data broken down by area of the city.
They were: children living in poverty, and extreme poverty; the rate of under-5s served by welfare programmes; the rate of 3-4 year olds enrolled kindergarten; rates of under-5 chronic malnutrition, mortality and vaccination; the adolescent birth rate; domestic violence; and population density. As the heatmap shows, Ciudad Bolívar emerged as the area with the greatest challenges.
[wp_colorbox_media url=”https://vanleerfoundation.org/wp-content/uploads/2017/10/map-needs.png” type=”image” hyperlink=”https://vanleerfoundation.org/wp-content/uploads/2017/10/map-needs.png”]
Next, we created a map of current and planned official interventions. Our thinking was that working alongside such interventions would offer greater potential opportunities to make a difference.
[wp_colorbox_media url=”https://vanleerfoundation.org/wp-content/uploads/2017/10/map-oportunities.png” type=”image” hyperlink=”https://vanleerfoundation.org/wp-content/uploads/2017/10/map-oportunities.png”]
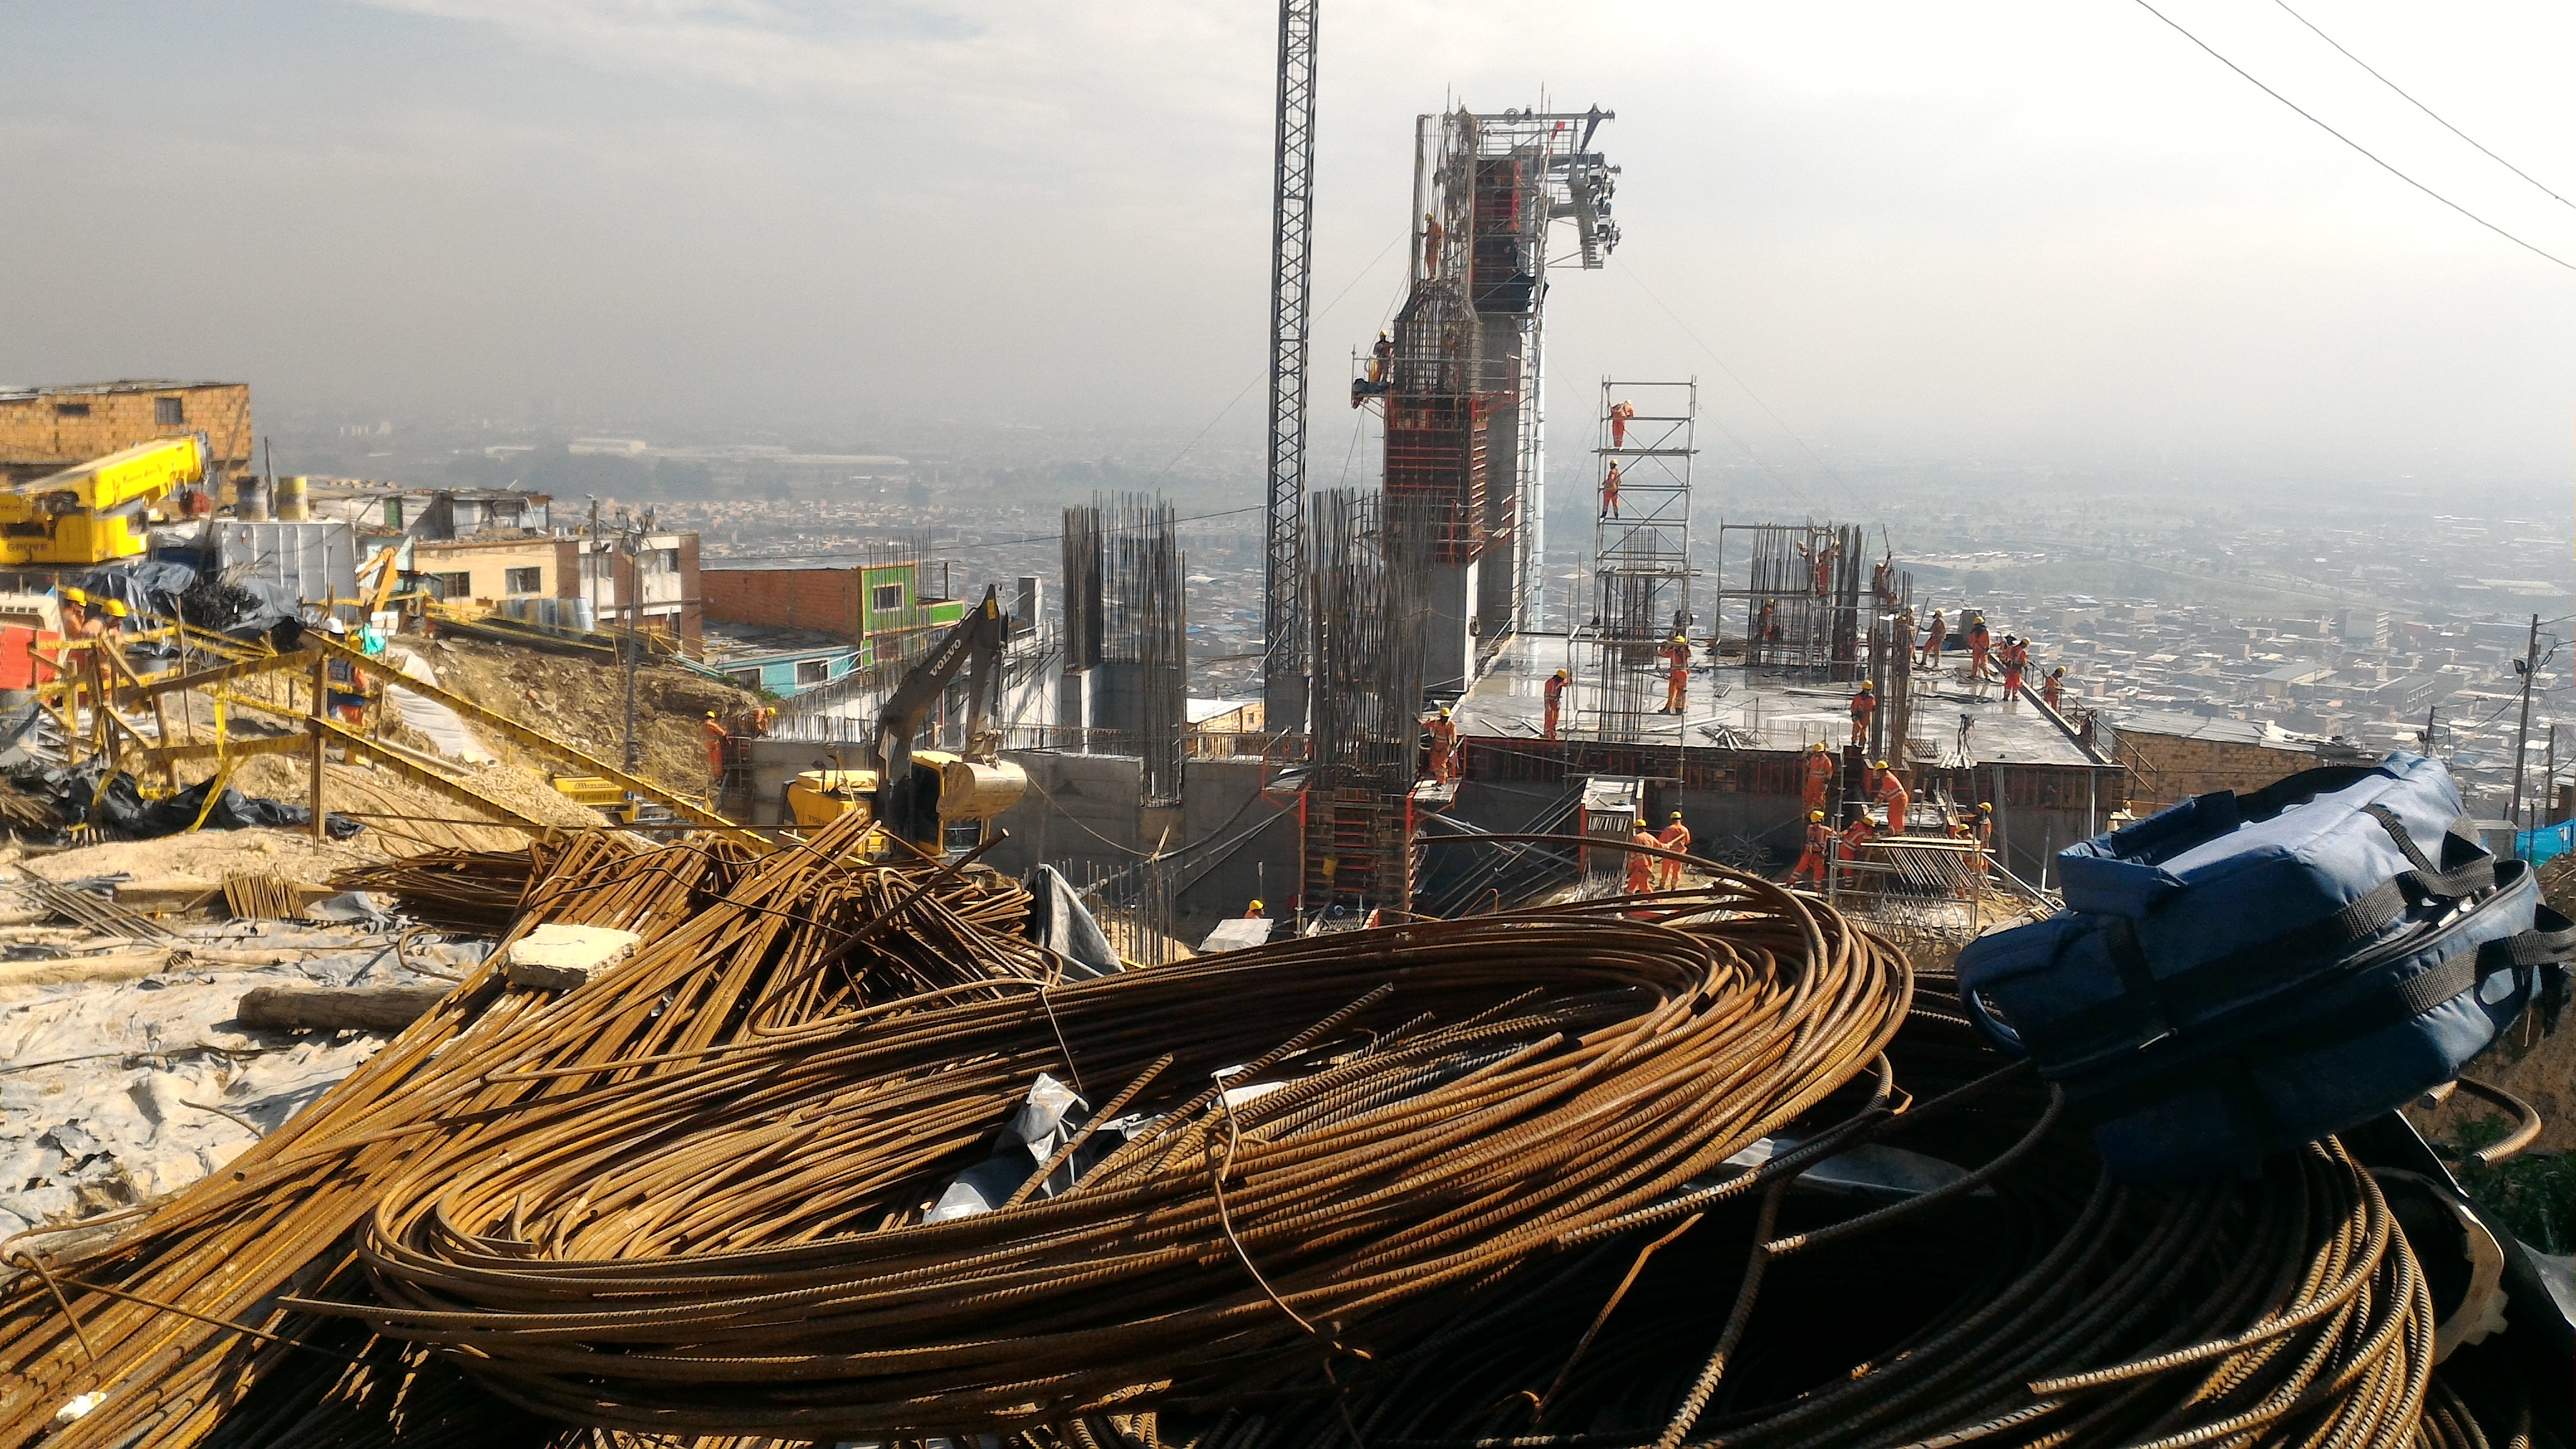
Here, the heatmap shows only part of the story, as one ongoing intervention stood out as presenting a unique opportunity: the construction of Transmicable, a cable car that will halve the commuting time between the upper part of the district of Ciudad Bolívar and El Tunal, the main Bus Rapid Transit station. Together with our civil society and public sector partners, we decided that the construction work would create a feeling of change in Ciudad Bolívar which the Urban95 project could leverage.
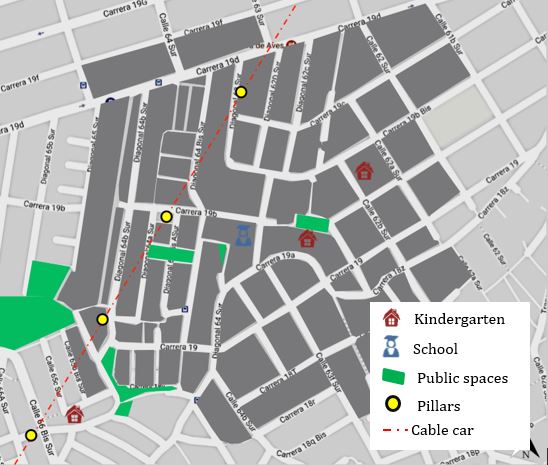
It then made sense to narrow our focus further by looking at those communities in Ciudad Bolívar which would be most affected by the construction: those directly surrounding stations and pillars. But which to choose? We again looked for publicly available data to create heatmaps that would illustrate need.
We used data from the district authorities on crimes reported to the police per household, and on the proportion of public space (m2) relative to the constructed volume of construction (m3). Overlaying the maps with the cable car route – its pillars are shown as green dots – we could identify areas along the route which combined a relatively poor security situation with lack of public space.
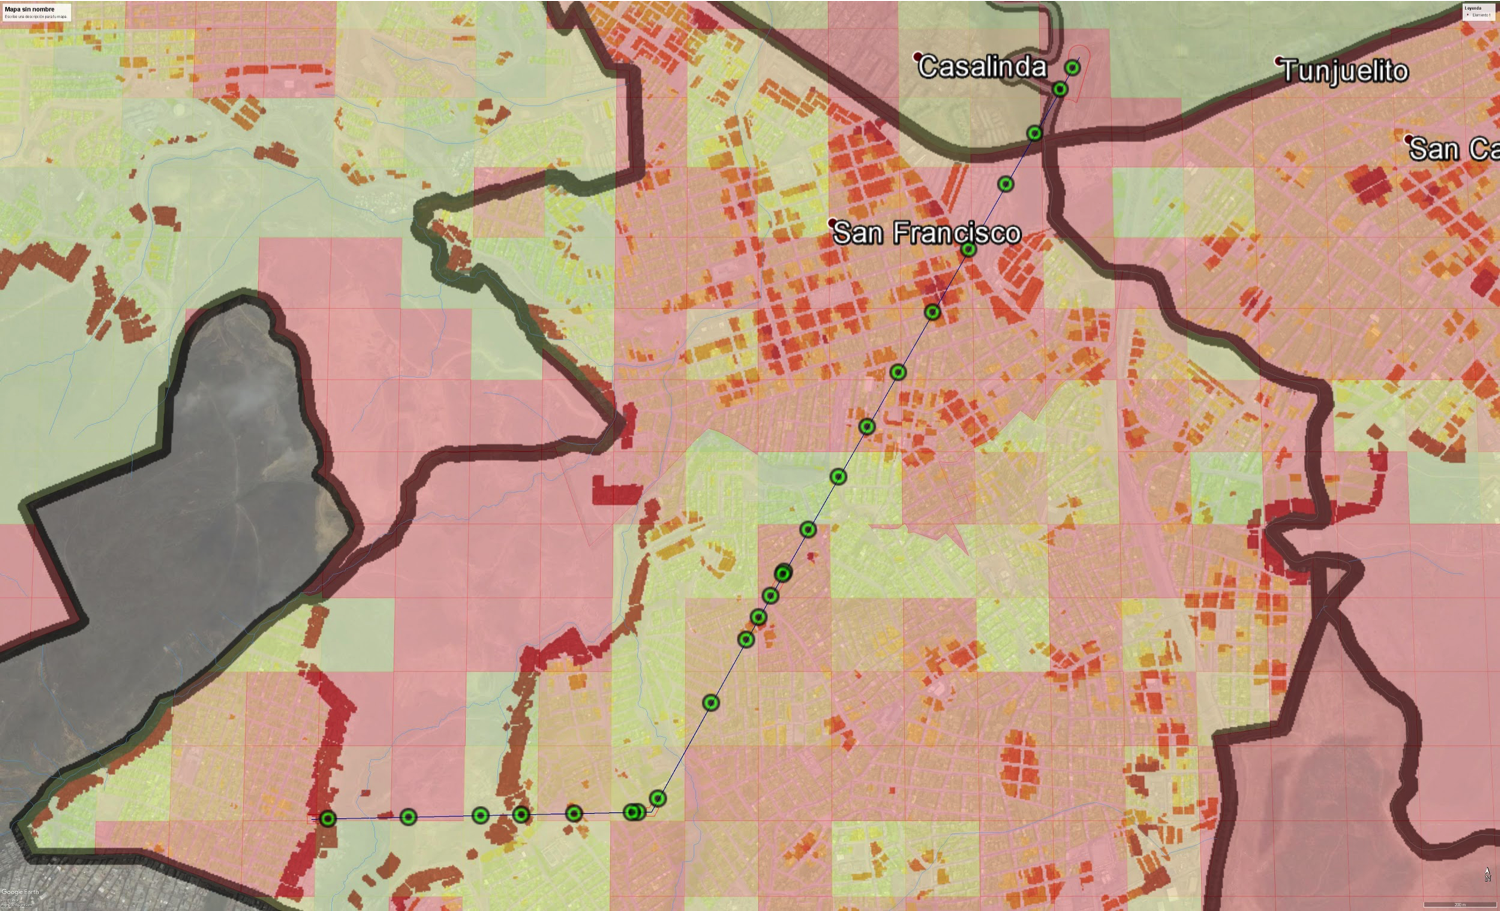
From this map, we identified four possible zones. Now it was time to go from data mapping to investigating the situation on the ground with our own eyes. Together with District of Bogotá partner offices, we made field trips to those zones to identify locations such as kindergartens, schools and public spaces which looked promising for the Urban95 pilot project to work with.
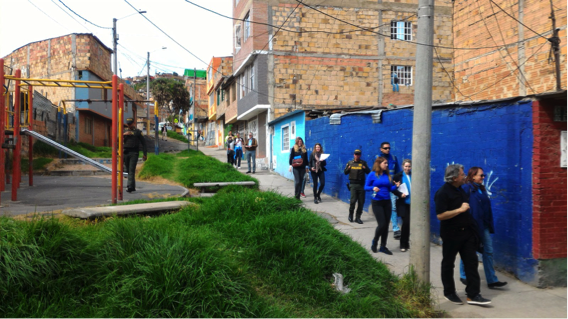
Based on the field trips, the team agreed to work in the area of San Francisco, in the middle of the cable car route. Now we had to narrow down the area of intervention: how big should it be, and which streets should it include?
We already knew what should be our central point in San Francisco – the cable car pillars. (Other cities using a similar approach of working outwards from a central point could instead choose to focus on a school, kindergarten or park.) We started by drawing circles on a map around the pillar – of 100, 150, 200, 350 and 500 metres – and counting up the services that fell within the circles.
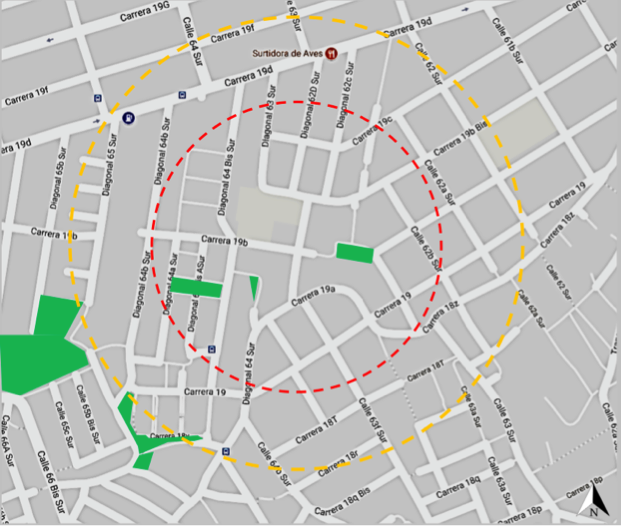
The project team chose to work within a radius of 200 metres, which brought in a meaningful and manageable number of services: two kindergartens, two elementary and high schools, and five potentially useable public spaces, in the Acacia and San Luis Colmena neighbourhoods of San Francisco.
The final stage was to go back onto the streets that fell close to that 200m radius, to define exactly which blocks would be included and which would not. The team made this judgement based on observations of how the streets relate to the area, and available demographic data on, for example, how many children under 5 live in each street.
With the area of the pilot intervention defined, we started work on a survey to learn more about the families who live there. In August, we began to collect data from about 400 families, to strength the project’s baseline and improve the design of its interventions.
 Author: Juan David Villamarin Garcia
Juan David is a political scientist, with a emphasis on public policy studies at the National University of Colombia. He holds a postgraduate degree in Management for development projects and has nearly 10 years of experience in social and development projects, working hand in hand with communities and local governments in areas of conflict, as well as in small and main cities, focused on overcoming social barriers, and on improving the formulation and adoption of public policies from a participatory perspective.
Actually, he is working for Social Integration Secretary, as the mananger of Urban95, Crezco con mi barrrio (I grow with my neighborhood) project. His main tasks are the relationship with the different participating offices of the project, advisory organizations and donors. Likewise, the relationship with the beneficiary community of the project and with local political representation agencies, seeking to manage support and resources by the city, in addition to those provided by the Bernard Van Leer Foundation.